1. Why Tea Has No "C-Price": Fragmentation vs. Coffee/Cocoa
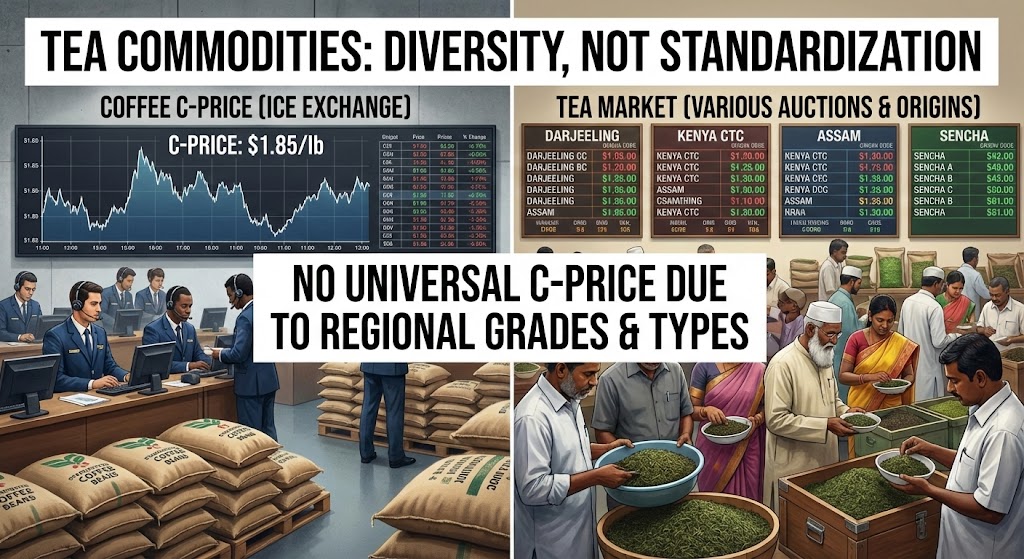
Coffee and Cocoa commodity benchmarks: Coffee C-Price (Intercontinental Exchange ICE—global futures contract, Arabica benchmark trades 100,000+ contracts daily, universal reference "Colombian coffee = C-Price + $0.40/lb" pricing structure), Cocoa futures (ICE London/NYC—similar standardization, West African cocoa priced off single benchmark). Why this works: Product homogeneity (Arabica coffee beans—functionally similar quality from Colombia/Brazil/Ethiopia, blenders interchange origins easily), large-scale standardization (cocoa beans—bulk commodity minimal differentiation, processors don't care Ghana vs. Ivory Coast).
Tea's fragmentation problem: No universal benchmark (black tea from Kenya CTC ≠ Darjeeling orthodox ≠ Ceylon high-grown—completely different products, can't substitute in blends without changing character), multiple processing methods (orthodox vs. CTC vs. green tea—see rolling vs. green processing, creates separate markets not unified commodity), origin specificity matters (Darjeeling GI protection—can't replace with Kenyan, consumers taste difference unlike coffee where blend consistency hides origin). Result: Regional auctions not global futures (Mombasa, Kolkata, Colombo operate independently—see Mombasa mechanics, no single "tea price" exists only regional benchmarks).
Historical attempts at tea futures: London Tea Futures Market (1970s-1980s—failed within decade, insufficient trading volume, hedging didn't work because tea too diverse couldn't standardize contract), India commodity exchange experiments (2000s MCX tea futures—minimal participation, estates preferred auction certainty over futures speculation), China tea futures proposals (ongoing discussions—but green tea vs. black tea vs. puerh fragmentation prevents unified contract, see puerh as separate asset class). Why failure persists: Growers resist standardization (premium teas—Darjeeling/Ceylon estates want differentiation not commodity pricing, specialty value destroyed by futures contract lumping), buyers prefer auctions (physical inspection + tasting—critical for quality control, futures contract trades paper not actual tea quality uncertain).
2. Regional Price Dynamics: How Markets Interact
Loose coupling between regions: Mombasa-Kolkata correlation (moderate ~0.4-0.6 correlation—both supply CTC to similar buyers, Kenya drought → buyers shift to India → Kolkata prices rise 10-15%, but origins not perfect substitutes so partial correlation only), Colombo independence (weak correlation <0.3 with Mombasa/Kolkata—Ceylon specialty positioning, different buyer base luxury brands vs. mass-market tea bags, Sri Lanka crisis barely affected Kenya/India prices 2022). Arbitrage opportunities: Rare and limited (shipping costs + quality differences—prevent pure arbitrage, can't buy Mombasa $2.50/kg ship to India sell Kolkata $2.80/kg because buyers want Indian tea specifically not Kenyan substitute).
Influence of global tea oversupply: Structural surplus 2010-2025 (world production 6.5 million tonnes—consumption 6.0 million tonnes, chronic oversupply ~8% excess depresses all markets), downward price pressure (real prices declining—inflation-adjusted tea 30% cheaper 2020 vs. 2000, farmers squeezed see fair trade economics), inventory build-up (warehouses globally—holding 18-24 months consumption, buyer leverage strong can wait for lower prices no urgency). Regional exceptions: Specialty orthodox tea (Darjeeling first flush—see seasonal premium, limited supply high demand prices rising despite overall surplus, niche insulated from commodity dynamics), geographic constraints (Nepal high-altitude—can't expand production, premium persists even in oversupplied market).
| Market Characteristic | Coffee (C-Price Exists) | Cocoa (Futures Exist) | Tea (No Global Benchmark) |
|---|---|---|---|
| Product Standardization | HIGH (Arabica beans fungible) | HIGH (bulk cocoa beans uniform) | LOW (CTC ≠ orthodox ≠ green tea) |
| Origin Substitutability | HIGH (Brazil replaces Colombia) | HIGH (Ghana replaces Ivory Coast) | LOW (Kenya can't replace Darjeeling) |
| Price Discovery Method | Futures exchange (ICE) | Futures exchange (ICE) | Regional auctions (Mombasa/Kolkata) |
| Global Benchmark | Yes (C-Price USD/lb) | Yes (ICE cocoa USD/ton) | No (multiple regional prices) |
| Hedging Availability | Excellent (liquid futures) | Excellent (liquid futures) | Poor (limited options contracts) |
3. Volatility Analysis: Price Swings and Stability
Short-term volatility (weekly/monthly): Mombasa auction fluctuations (typical week-to-week ±$0.10-0.30/kg—see auction dynamics, supply-driven weather news, 5-12% price swings common), Kolkata seasonal patterns (first flush premium spikes—see Darjeeling seasonality, 30-50% price increase March-May vs. monsoon flush July-September, predictable annual cycle). Drivers of short-term moves: Weather shocks (Kenya drought forecast—prices jump 15-20% within 2-3 weeks as buyers anticipate shortage, reversed when rains arrive), labor disruptions (Assam strikes—immediate 10-15% spike, resolved quickly once picking resumes), currency volatility (Kenyan Shilling crash 10%—makes tea cheaper for USD buyers, demand surge supports prices).
Long-term trends (annual/decadal): Real price decline (inflation-adjusted tea prices—falling 1-2% annually 2000-2020, oversupply + productivity gains, farmer income pressure chronic), nominal price stability (USD prices roughly flat—$2.50-3.00/kg range for CTC, inflation erodes real value but headline prices don't crash dramatically), quality premiums widening (gap between commodity CTC ($2.50/kg) and specialty orthodox ($8-15/kg) expanding—bifurcated market, mass commodity stagnates while premium grows). Structural factors: Overplanting legacy (2000s expansion—Kenya/India/Vietnam planted millions of hectares, takes 30 years for tea bushes to decline, supply overhang persists), demand growth slow (Western consumption flat—aging demographics drink less tea, emerging markets growing but not fast enough offset oversupply, see recession effects).
4. Speculation and Stockpiling: Market Manipulation Risks
Warehousing strategies: Trader stockpiling (buy low auctions—store 6-12 months, sell high when prices recover, works if quality degradation minimal during storage), volumes involved (major traders hold 50,000-200,000 tonnes—equivalent to 1-3% global annual production, sufficient to influence market when released/withheld). Risk factors: Storage costs (warehouse rent + insurance—$0.05-0.10/kg/month, erodes profit margins if prices don't rise fast enough), quality loss (even with good storage—tea loses 10-20% flavor intensity after 12 months, black tea more stable than green but still degrades, limits holding period practical maximum 18-24 months).
Historical manipulation examples: 2008°Kenya drought speculation (traders anticipated shortage—bought aggressively, stockpiled 80,000 tonnes, prices spiked 35% within 8 weeks, rains returned earlier than forecast traders dumped stock prices crashed 25% in month), losses significant for late speculators (bought high sold low—estimated $15-20 million combined losses, reinforced auction vs. futures preference estates don't trust speculative markets). 2016 Assam flood recovery play (floods reduced production—buyers expected extended shortage, prices rose 20%, but Nepal/Kenya filled gap quickly, speculators caught holding expensive inventory sold at loss when prices normalized).
Regulatory limitations: No futures exchange oversight (unlike coffee/cocoa where CFTC monitors—tea markets unregulated, position limits don't exist, theoretically one buyer could corner regional auction), practical constraints prevent extreme manipulation (physical commodity bulkiness—200,000 tonnes = massive warehouse space, logistical difficulty limits hoardable volumes, estates can refuse to sell if auction prices seem manipulated shift to direct sales). Buyer collusion rare: Oligopsony concerns (top 5 buyers control 50-60% Mombasa volume—theoretically could coordinate suppress prices, but antitrust risk + competitive pressures prevent overt collusion, implicit coordination possible but hard to prove).
5. Currency Hedging and Exchange Rate Impacts
Multi-currency complexity: Producers earn local currency (Kenyan estates—paid in Shillings at auction, Indian estates in Rupees), buyers pay USD/EUR (international blenders—dollar-denominated purchases, currency conversion introduces exchange rate risk), tea shipped globally (freight costs in USD—see logistics economics, final consumer prices in GBP/EUR local currencies). Who bears currency risk: Typically producers (estates receive local currency—auction prices in USD converted at spot rate, Shilling weakness = local currency revenue boost even if USD price flat, Shilling strength = revenue squeeze).
Currency shock examples: 2015°Kenyan Shilling devaluation (KES weakened 15% vs. USD over 6 months—Kenyan tea became cheaper for international buyers, demand increased, auction prices rose 8% in USD terms but 25% in KES terms windfall for estates), estates couldn't sustain (currency rebounded 2016—USD prices fell back, KES gains evaporated, demonstrated currency volatility complicates producer planning). Sri Lanka 2022 crisis (Rupee collapsed 50%—Ceylon tea dirt-cheap for buyers, but fertilizer import costs in USD skyrocketed, estates couldn't afford inputs despite export competitiveness, production fell 20% paradox of currency crisis).
Hedging strategies (limited adoption): Forward contracts (estates lock in future exchange rate—protects against currency crash, but requires sophisticated treasury function + banking relationships, only large estates 10,000+ hectares use, smallholders exposed), natural hedges (some estates import inputs—fertilizer/machinery in USD, USD tea revenue offsets USD costs partial natural hedge, but most costs local labor so incomplete protection). Currency speculation: Traders exploit (buy tea when producing-country currency weak—stockpile, sell when currency recovers and tea expensive in USD terms, dual profit from currency + commodity timing, adds volatility to auction prices beyond pure supply-demand).
6. Comparison to Other Agricultural Commodities
Tea vs. Coffee market structure: Coffee advantages = Organized futures (hedging available—growers/buyers manage risk, fair trade pricing often references C-Price floor), global benchmark simplifies ("Vietnam Robusta = C-Price - $0.60" universal language, contract farming straightforward). Tea disadvantages = Fragmented auctions (regional price discovery—difficult for small buyers to access multiple markets, tea bag blenders must monitor Mombasa + Kolkata + Colombo separately), no hedging instruments (estates bear full price risk—can't lock in future prices, planning difficult when harvest 6 months away may sell $2.50 or $3.50/kg unknown).
Tea vs. Cocoa concentration: Cocoa production concentrated (West Africa 70% of global—Ivory Coast + Ghana dominate, political stability those two countries determines global prices), tea production dispersed (China 45%, India 20%, Kenya 10%, Sri Lanka 5%, Vietnam/Indonesia/others 20%—no single origin dominates, diversification buffers global supply but complicates benchmarking). Processing differences: Cocoa beans uniform (fermentation + drying—standard globally, chocolate manufacturers don't care bean origin just quality specs), tea processing varies (CTC vs. orthodox vs. green—creates product differentiation, manufacturing advantage tea industry but market fragmentation disadvantage).
Why Fragmentation Persists
Economic incentives favor differentiation: Premium teas (Darjeeling GI, Ceylon high-grown—estates earn 3-5x commodity prices through origin branding, standardization destroys this premium), processing diversity (CTC vs. orthodox creates different markets—see rolling techniques, estates specialize rather than homogenize), consumer preferences (specialty tea buyers—value terroir + uniqueness, commodity futures would erase what they're willing to pay extra for). Result: Unlike coffee where Colombia/Brazil Arabica largely fungible, tea markets likely remain fragmented indefinitely. Commodity CTC may get regional benchmarks stronger, but global "tea price" unlikely next 20-30 years.
7. Future Market Evolution: Consolidation or Fragmentation?
Forces toward consolidation: Electronic trading platforms (emerging digital auctions—could link Mombasa/Kolkata/Colombo, single login access all markets, technology reduces friction), standardization pressure (multinational blenders—want simplified sourcing, push estates toward uniform CTC specifications, homogenization creates commodity potential), climate change forcing adaptation (traditional origins failing—Darjeeling yields declining heat stress, new origins like Nepal/Rwanda rising, established terroirs lose differentiation opens commodity possibilities). Blockchain traceability (experimental projects—could standardize quality verification, smart contracts automate auction participation, reduces need for physical inspection might enable futures).
Forces toward fragmentation: Specialty tea growth (consumer premiumization—willing pay $20-40/kg for artisan tea, see GI protection trends, differentiation rewarded not punished), direct trade movement (see economics—estates bypass auctions entirely, relationship-based pricing, further undermines auction centrality + benchmark potential), climate terroir intensification (some argue climate change enhances origin specificity—Darjeeling becomes more unique not less, Assam muscatel character impossible to replicate preserves fragmentation). Puerh asset class (see investment dynamics—aged tea financial speculation separate from commodity tea, demonstrates fragmentation extreme where tea becomes collectible not agricultural product).
Probable 2030 landscape: Bifurcated market persists (commodity CTC—may achieve partial standardization regional benchmarks strengthen, specialty orthodox—continues fragmenting into micro-origins + single-estate branding), auction relevance declines gradually (from 70% of global trade 2020 → 50% by 2030—direct trade grows but auctions survive for price discovery function), no global tea futures likely (fragmentation too deep—coffee/cocoa model doesn't translate, regional electronic platforms more realistic than ICE tea contract). Currency integration (potential dollar-denominated contracts—reduce FX volatility, estates paid USD directly instead of local currency conversion, simplifies but requires financial infrastructure investment Kenya/India/Sri Lanka governments unlikely prioritize).
Comments